

Mixpanel’s Heatmaps: Uncover the “why” behind user behavior—faster

Every product journey begins with a question: What are users doing—and why?
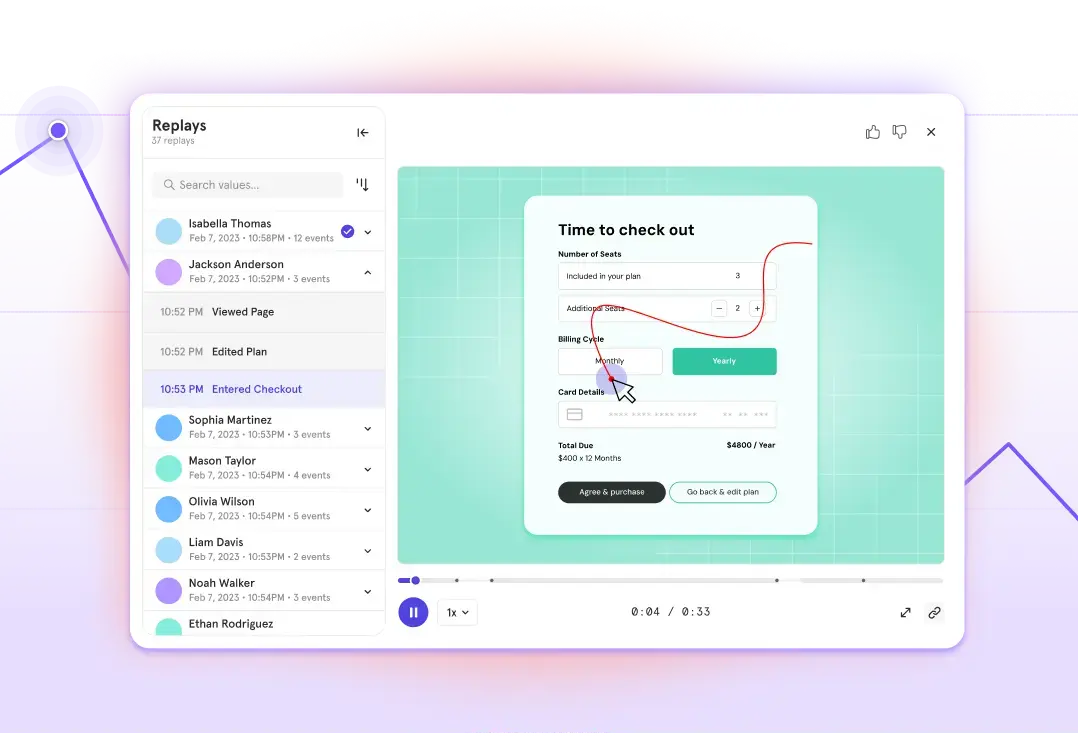
In 2024, we introduced Session Replay, giving teams a powerful way to start exploring the why behind user behavior. Then came server-side stitching, which unlocked visibility into every interaction (even ones happening behind the scenes, like server-side or warehouse events). Now, we’re introducing another step-change: Heatmaps, a faster way to visualize user behavior and accelerate the time from observation to action.
Introducing Mixpanel’s Heatmaps
Mixpanel’s Heatmaps provide an aggregated, visual layer to your analytics that help answer that question faster. Combined with Session Replay and event-based reports, Heatmaps give teams a clearer way to observe user behavior, analyze patterns, decide with confidence, and act more quickly, all in one continuous flow.
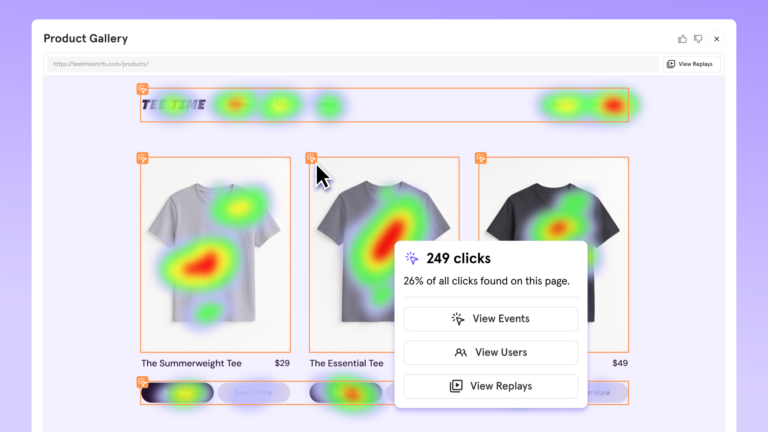
Whether you're tracking conversion paths, exploring friction in onboarding flows, or spotting engagement trends across dynamic pages, Heatmaps help you find patterns, pain points, and opportunities at a glance, without sifting through endless replays.
Start with the big picture
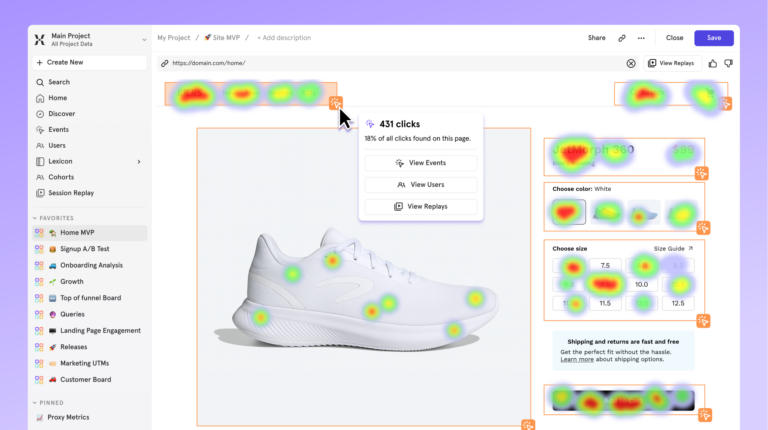
When something’s off, like a drop in conversion or a spike in churn, it’s easy to get lost in the numbers. Heatmaps help you zoom out and see the big picture first.
Quickly see hot spots, cold zones, and missed clicks. Then analyze deeper using filters like events, properties, or user cohorts. With one click, jump into relevant session replays—so you can decide what matters and act without second-guessing.
It’s a convenient, seamless workflow that brings clarity to your customer journey, all within Mixpanel.
Why Mixpanel’s Heatmaps are unique
Unlike standalone tools, Mixpanel’s Heatmaps are fully integrated into your analytics workflow, so you don’t lose time, context, or trust.
- One platform, no silos: Go from reports → heatmaps → replays in seconds
- Targeted insights, without the noise: Filter by events, properties, or cohorts to cut out noise and zero-in on the moments that matter
- Data you can trust: Heatmaps are powered by click data captured directly from your users’ interactions, and easy to validate with event-based tracking and replays.
The result? A faster, more focused way to improve your product.
Get an overview of the "why" with Mixpanel Heatmaps
Say you’re a product manager responsible for sign-ups, and you notice a dip in your funnel report. You generate a heatmap focused on users who dropped off, and instantly, a hot spot jumps out: users are clicking over to the pricing page before completing the form.
With one click, you open relevant session replays and see the pattern in action. Users are clearly looking for pricing information they didn’t see and leaving the page to find it.
Within minutes, you’ve gone from spotting the issue —> to understanding why it’s happening —> to knowing exactly how to fix it. All without switching tools.
Try Heatmaps today
If you already have Mixpanel Session Replay enabled, you’re just one snippet away from turning on Heatmaps. To add the snippet and get started, check out the documentation or contact your Mixpanel team member.
This is just the beginning. Heatmaps are part of Mixpanel’s growing digital analytics platform, designed to bring qualitative and quantitative insights together—so teams can learn faster, act smarter, and create better experiences for their customers.